Quick Summary
| Criteria | Our Verdict |
| Platform Type | Technical Analysis & Charting Software |
| Founded | 2018 by Dan Ushman |
| Main Focus | Automated Technical Analysis, Backtesting, & Alerts |
| Pricing | From $39/month (Basic) to $149/month (Elite) |
| Best For | Active Traders & Technical Analysts |
| Overall Rating | ★★★★☆ (8.6 / 10) |
Introduction
Among charting platforms competing for traders’ attention, TrendSpider has emerged as one of the few genuinely innovative tools in recent years. Founded by Dan Ushman, the platform’s core idea is simple yet powerful: automate the tedious parts of technical analysis so traders can focus on strategy and execution.
Where most charting tools offer static indicators and manual drawing tools, TrendSpider leverages automation, machine learning, and data-driven alerts to deliver a smarter, faster, and more objective trading workflow.
In a market often saturated with noise and marketing gimmicks, TrendSpider feels like a tool designed by traders — for traders.
Platform Overview
TrendSpider’s interface resembles traditional platforms like TradingView or ThinkorSwim at first glance. But beneath the surface, it’s packed with proprietary features that set it apart.
Key highlights include:
- Automated Trendline Detection – identifies significant support and resistance zones using objective algorithms rather than subjective drawing.
- Multi-Timeframe Analysis – allows overlaying multiple timeframes on a single chart, saving traders from constant toggling.
- Raindrop Charts® – a unique visual combining volume and price action to highlight real buying/selling pressure in each candle.
- Dynamic Alerts – trigger alerts based on trendline breaks, indicator levels, or price zones.
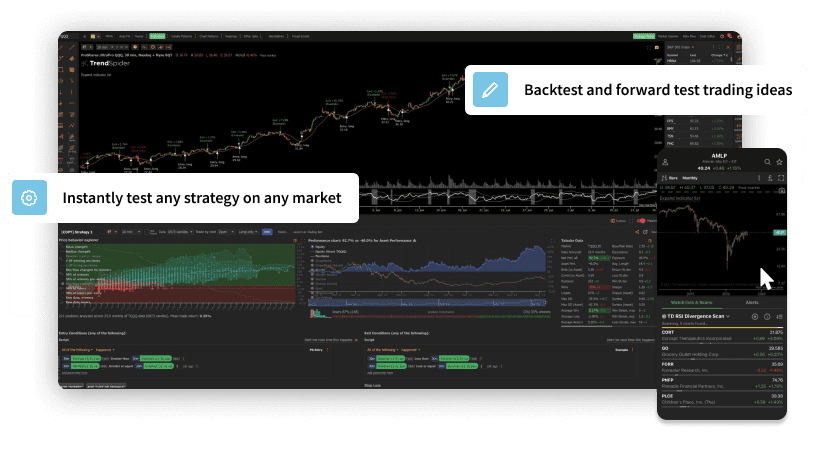
- Backtesting Engine – lets traders test strategies directly on the chart, with visual entry/exit markers.
- Smart Watchlists – automatically surface assets meeting specific technical conditions.
The platform is entirely browser-based but includes a robust desktop feel. It runs smoothly across devices, with performance tuned for real-time updates and institutional-level data feeds.
Technology and Innovation
TrendSpider’s core differentiator lies in its automation engine. It eliminates the need for manual redrawing of trendlines every time new price data arrives — a chronic time sink for active traders. The software constantly recalculates and adjusts these lines in real time, maintaining accuracy as conditions evolve.
The platform’s Raindrop Charts are another standout feature. By integrating volume directly into the candle body, they reveal how buying and selling activity is distributed across the price range — something traditional OHLC bars simply can’t show. Many professional traders now use Raindrops to confirm breakouts or spot fake-outs before they develop.
These innovations collectively push TrendSpider into the “next-gen” category of trading tools — bridging the gap between manual charting and quantitative systems.
Usability and Learning Curve
Despite its technical depth, TrendSpider’s interface is remarkably intuitive once users understand its logic. The layout is customizable, with adjustable panels for indicators, alerts, and watchlists. The Hotlist Scanner provides real-time scanning across stocks, crypto, or forex markets, and the drag-and-drop alert creation system makes automation approachable even for beginners.
However, the learning curve is real. Traders coming from basic charting platforms like TradingView may initially feel overwhelmed by the layers of features. Fortunately, TrendSpider mitigates this with an extensive tutorial library, weekly webinars, and one-on-one onboarding sessions for new users — support that’s rarely seen in this software tier.
Once the initial setup is complete, many traders report a tangible improvement in workflow efficiency, especially when managing multiple tickers or timeframes.
Data Coverage and Markets
TrendSpider covers a wide range of markets including:
- U.S. and international equities
- ETFs and indices
- Forex pairs
- Major cryptocurrencies
- Select futures and commodities
Real-time data is included in upper-tier plans, while delayed feeds suffice for swing traders on lower tiers. Integrations with broker platforms are still somewhat limited — it’s primarily a charting and analysis tool, not a full execution platform.
That said, the software’s Webhooks and API support allow automation for traders using external brokers or algo systems.
Pricing and Value
TrendSpider offers three main subscription tiers:
- Essential ($39/month) – basic charting, indicators, and single-chart scanning.
- Advanced ($79/month) – unlocks multi-timeframe analysis, custom alerts, and dynamic scanning.
- Elite ($149/month) – adds real-time data, advanced backtesting, and premium support.
Annual plans offer discounts of around 20%. A free trial is available, and TrendSpider often runs promotional discounts for new users.
While not the cheapest option, the platform’s automation and data integration can replace multiple tools — making it cost-effective for active traders who value precision and time savings.
In essence, TrendSpider’s pricing reflects its positioning: professional-grade charting for serious traders, not hobbyists.
Support and Community
TrendSpider maintains strong customer service standards — including live chat, email, and scheduled training calls. Its YouTube channel provides daily educational content, while the active Discord community allows users to share setups and discuss feature updates.
This balance of support and community education gives TrendSpider a competitive edge over purely technical tools like MetaTrader or NinjaTrader, which often leave users to self-teach.
Pros and Cons
Pros
- Cutting-edge automation (trendlines, alerts, scanning)
- Innovative “Raindrop” chart visualization
- Clean, professional interface
- Deep educational resources and live support
- Suitable for equities, crypto, and forex
Cons
- No direct trade execution (analysis only)
- Learning curve for beginners
- Higher pricing tiers required for real-time data
- Limited mobile app functionality
Comparison to Alternatives
Compared to competitors like TradingView, TrendSpider is more focused on automation than social features. TradingView remains better for idea sharing and community visibility, but TrendSpider wins decisively on technical sophistication and scanning capability.
Against MetaStock or TC2000, TrendSpider offers a more modern UX and browser-based convenience. And when placed beside pure-education brands like The Chart Guys or Asia Forex Mentor, it functions as the perfect tool complement rather than a competing product.
In short: where AFM and TCG teach the “why” and “how,” TrendSpider executes the “what” — translating theory into precision-driven chart setups.
Verdict
TrendSpider has matured from an experimental automation project into a serious trading platform for modern analysts. It’s one of the few charting tools that genuinely enhances decision quality rather than simply displaying data.
For traders who value speed, accuracy, and structure, it represents a clear upgrade over traditional platforms. It won’t make decisions for you — but it will make your decision-making sharper.
Casual traders might find the learning curve or cost hard to justify, but for professionals and semi-pros, it’s a worthwhile investment.
Overall Rating: 8.6 / 10 (★★★★☆)
Smart, disciplined, and data-driven — TrendSpider is the thinking trader’s charting platform.